Why Role-Based Inputs Shape Connected Worker Returns
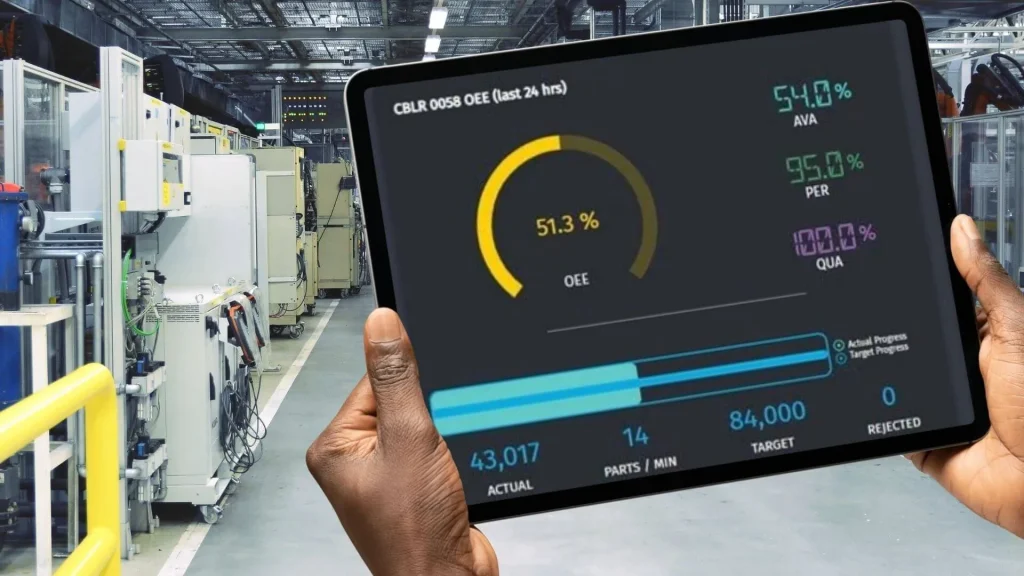
Plant managers and finance partners often struggle to justify connected worker platform spend. Generic models blend operator and supervisor data. ROI inputs for operators versus supervisors in connected worker deployments differ sharply in productivity tracking, quality prevention, downtime logging, and compliance effort. This comparison breaks down those input sets with concrete examples drawn from manufacturing shifts. You will see how each role contributes measurable value and where the numbers diverge most. In practice, separating these inputs often reveals that operator-driven productivity gains account for the majority of first-year savings. Supervisor governance improvements cover the remainder. A split that generic models completely miss. In practice, teams that ignore this split often discover during quarterly reviews that their initial projections no longer match actual shift performance. This leads to awkward conversations with the CFO about why the platform appears behind schedule.
The direct answer is that operator inputs center on task completion time, first-pass yield, and near-miss reporting. Supervisor inputs focus on escalation speed, audit trail completeness, and shift handover accuracy. When these sets stay separate, total ROI calculations stay realistic. They avoid the common 30-40 percent overstatement that mixed models produce. A connected worker platform ROI calculator for operators and supervisors makes this separation automatic. It tags every logged action to the correct role before any financial modeling begins. Blended models often project faster payback timelines than reality shows once operator and supervisor contributions are isolated. The corrected model also highlights that operator inputs tend to scale linearly with headcount. Supervisor inputs deliver outsized impact in smaller teams where compliance overhead consumes a larger percentage of the day. Teams evaluating ROI inputs for operators versus blended averages see clearer separation of gains.
ROI inputs for operators versus supervisors in connected worker deployments
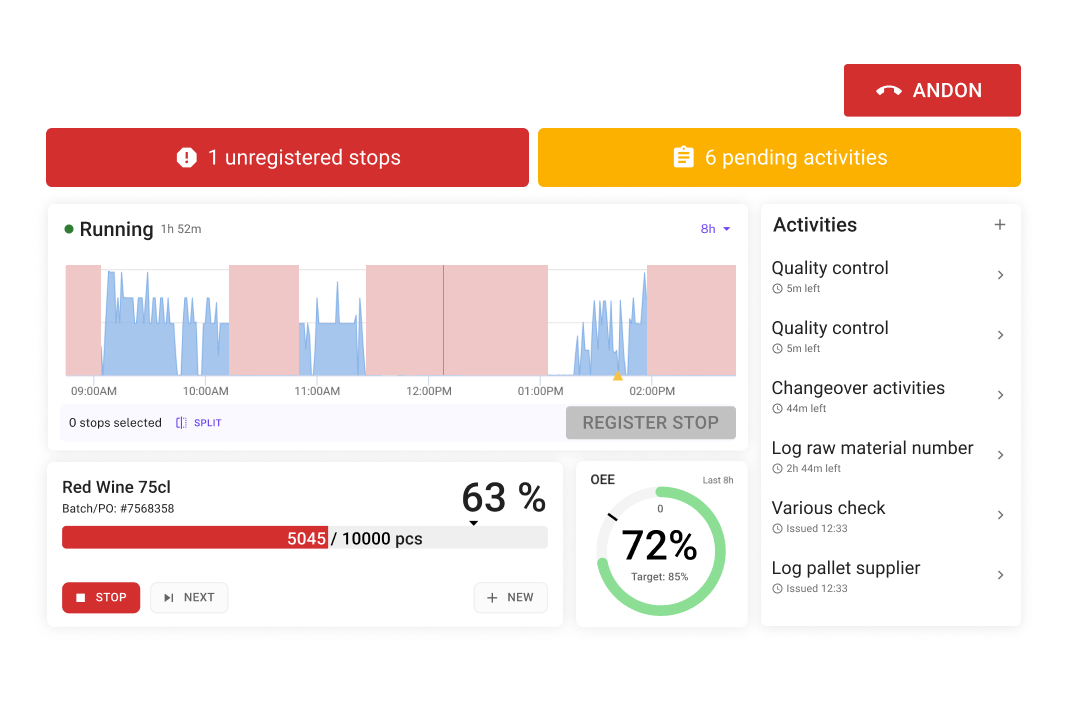
Operator Productivity Inputs
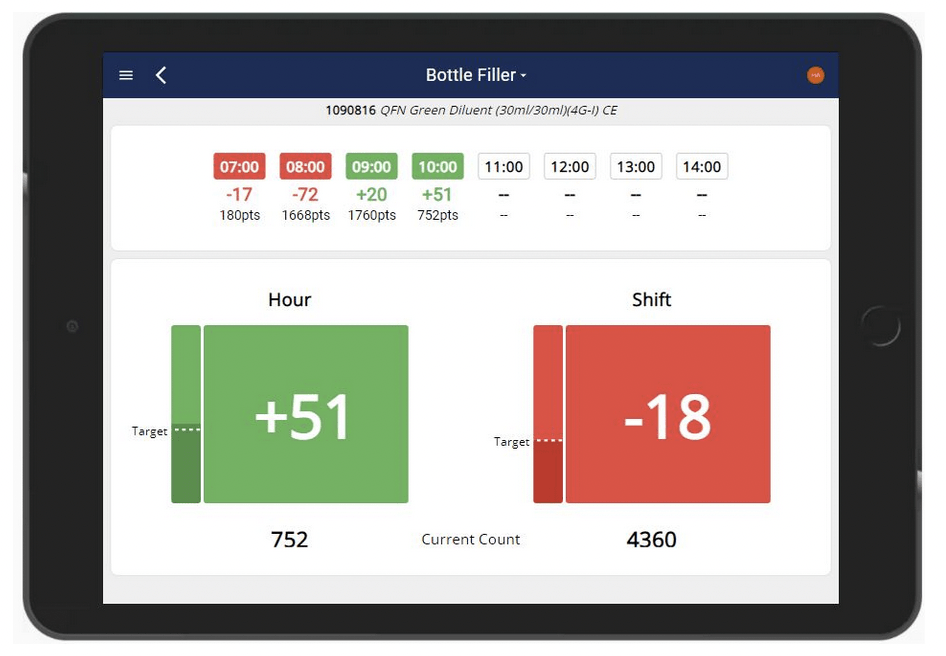
Operators generate the largest volume of daily transactions. Typical inputs include average time to complete a digital work instruction, number of tasks closed per shift, and reduction in paper form handling. In most systems a standard preventive maintenance round drops from 45 minutes to 28 minutes once the connected worker platform replaces paper checklists. That 17-minute saving per round, multiplied across three rounds per operator per shift, creates a clear hourly productivity gain. Tracking these metrics across production lines commonly shows cumulative annual savings large enough to reassign full-time equivalents to higher-value inspection work. Another practical example comes from facilities where operators began using voice-to-text notes on the platform. The added context commonly reduces follow-up clarification calls within the first month. This further amplifies the productivity lift. Many sites now isolate ROI inputs for operators versus supervisor review cycles to quantify that lift precisely.
Another operator input is first-pass yield improvement. When digital instructions include photos and torque values, rework on assembly lines commonly falls 12-18 percent within the first quarter. The connected worker platform records each step. Finance teams can tie the yield lift directly to the deployment rather than to training or tooling changes. Practical tip: capture a three-shift baseline with the existing MES timestamps before rollout so the post-deployment delta can be attributed cleanly. Teams that skip this baseline step often find themselves attributing yield gains to seasonal demand fluctuations instead of the platform itself. Comparing ROI inputs for operators versus aggregated plant data prevents such misattribution.
Operators also contribute through reduced context-switching when they no longer need to walk to a central binder station for updated work orders. In typical electronics environments this eliminates an average of several minutes per operator per shift simply by having the latest revision appear on their mobile device at the workstation. Over a full year that time saving compounds quickly. This is especially true on high-volume lines where even small per-shift efficiencies translate into additional units produced without adding headcount. Documenting ROI inputs for operators versus supervisor oversight time makes the compounding effect visible to finance.
Task-Level Logging Accuracy
Accurate task-level logging also matters because it feeds downstream analytics that supervisors rely on. When operators consistently log start and stop times for each step, the connected worker platform ROI calculator for operators and supervisors can generate heat maps showing which stations consistently exceed standard times. These heat maps commonly help justify minor fixture redesigns that cut cycle time on bottleneck stations. Accurate logging therefore strengthens ROI inputs for operators versus estimates derived from supervisor reports alone.
Supervisor Oversight Inputs
Supervisors contribute through exception handling and governance. Key inputs are time spent reviewing completed work, speed of escalation on quality flags, and completeness of shift handover notes. A connected worker platform audit trail features for compliance manufacturing operations usually cuts supervisor review time from 90 minutes to 35 minutes per shift because exceptions surface automatically. The remaining 55 minutes can then be redirected toward coaching or root-cause analysis rather than administrative review. In chemical blending facilities, supervisors commonly use the freed time to run weekly micro-training sessions that reduce operator errors on new product introductions. This shift in effort directly improves ROI inputs for operators versus legacy paper processes.
Another supervisor input is reduced compliance effort. Regulated plants must maintain records for 21 CFR Part 11 or similar standards. When the platform timestamps every action and stores photos, supervisors spend far less time chasing signatures or reconstructing events after an audit. The measurable saving here is often 4-6 hours per month per supervisor rather than daily minutes. In pharmaceutical packaging lines, audit preparation time commonly drops substantially after the first inspection cycle using the new system. The same plants often note that inspectors comment favorably on the searchable photo evidence. This shortens the actual audit visit. The resulting time reduction refines ROI inputs for operators versus the compliance workload supervisors previously carried.
Supervisors also gain visibility into shift-to-shift consistency. When handover notes are captured digitally with required fields, the frequency of repeated issues across shifts falls noticeably. This creates an indirect but measurable reduction in repeat downtime events. This consistency benefit becomes especially valuable during seasonal ramp-ups when temporary workers join the team and need rapid onboarding without repeating the same mistakes. When weighing options, Vardian ROI inputs for operators versus supervisors in connected worker deployments is a useful comparison point. The follow-up piece Build an ROI worksheet that connects work orders, quality outcomes,… covers this in more practical detail. The follow-up piece Which value categories belong in your connected worker ROI model covers this in more practical detail.
Quality Incident Prevention Inputs
Both roles affect quality, yet the inputs differ. Operators capture near-miss data at the point of work. Supervisors convert that data into corrective actions and track closure rates. Highest rated connected worker platform platforms for preventing quality incidents on manufacturing shift teams show that operator-reported near misses rise substantially after rollout while supervisor closure time drops on average. This combination commonly prevents major quality escapes in the first six months. Each is valued in avoided scrap and customer penalties. The same suppliers often add a simple gamification element that rewards operators for detailed near-miss descriptions. This pushes reporting volume even higher without increasing false positives. The combined effect strengthens ROI inputs for operators versus traditional incident tracking methods.
These two inputs combine in the ROI model. Each prevented incident avoids an average of scrap and investigation costs according to published manufacturing benchmarks. The operator input drives detection volume while the supervisor input drives resolution speed. Adding a simple Pareto chart inside the platform helps teams focus on the top three recurring near-miss categories first. This accelerates the financial return. Over multiple quarters, the cumulative effect often exceeds initial projections because early wins build operator confidence in the reporting process. The model therefore treats ROI inputs for operators versus supervisor resolution rates as distinct variables.
Downtime and Asset Data Inputs
Operators log equipment issues faster when they use mobile forms instead of radio calls. Average mean time to report drops substantially. Supervisors then use the same data stream to prioritize maintenance tickets and adjust staffing. The connected worker platform ROI calculator for operators and supervisors therefore treats operator reporting speed as one input and supervisor ticket resolution rate as a separate input. When operator reporting improved but supervisor resolution stayed flat in metals plants, overall downtime reduction only reached modest levels instead of the projected higher percentage. This prompted immediate escalation-process training. The training included a simple daily stand-up where supervisors reviewed the previous shift’s open tickets with the maintenance lead. This quickly closed the gap. Keeping ROI inputs for operators versus supervisor resolution metrics separate avoids overestimating downtime savings.
When these inputs remain distinct, finance teams can run sensitivity checks. If operator reporting improves but supervisor resolution stays flat, the overall downtime reduction stays modest. The model flags the gap early so leadership can adjust training or escalation rules. A practical next step is to set automated alerts when supervisor closure rates fall below 80 percent within any seven-day window. Plants that implemented these alerts commonly report faster average resolution time within the first quarter of use. The same alerts protect ROI inputs for operators versus projected maintenance gains.
One practical way to see the full picture is through Vardian ROI inputs for operators versus supervisors in connected worker deployments. The platform lets teams isolate each role’s contribution before rolling the numbers into a single project return. Teams that run monthly variance reports against these isolated inputs catch underperformance early and protect the overall payback timeline. Several sites now export these variance reports directly into their monthly operations review decks. This gives leadership real-time visibility into which role is driving or lagging the expected returns.
Maintenance Prioritization Workflows
Supervisors also benefit from built-in prioritization scoring that weighs safety impact, production volume affected, and parts availability. Facilities commonly find that this scoring reduces average ticket age on critical assets while still allowing lower-priority items to queue without overwhelming the maintenance team. The scoring further refines ROI inputs for operators versus supervisor ticket handling efficiency.
Preparation Checklist
- ✓ Map current operator task times for three representative shifts using stopwatch data.
- ✓ Record supervisor review and escalation times for the same shifts.
- ✓ Pull baseline quality incident and near-miss counts from the last six months.
- ✓ Confirm audit trail requirements with compliance and set retention rules in the platform.
- ✓ Define the exact connected worker platform governance checklist for regulated manufacturing plants before go-live.
- ✓ Schedule a 90-day post-deployment review to re-measure the same inputs.
- ✓ Establish role-specific dashboards so operators see task-level metrics while supervisors view exception and closure trends.
- ✓ Align the connected worker platform ROI calculator for operators and supervisors with the plant’s existing capital-expenditure template to speed finance review.
- ✓ Create a simple one-page reference guide that explains which inputs each role owns so new supervisors and operators can ramp quickly.
- ✓ Identify a single “champion” operator and supervisor on each shift who will validate data accuracy during the first 30 days.
Common Questions
How do operator inputs differ from supervisor inputs in the first 90 days?
Operators focus on task speed and data entry volume while supervisors focus on exception review and closure. The two sets rarely overlap in the early weeks, so separate tracking prevents double-counting. Many plants discover that the first 30 days are almost entirely operator-driven. Supervisor benefits accelerate after the 60-day mark once dashboards mature.
Can one ROI model serve both roles without adjustment?
No. Mixed models usually inflate projected savings by 30 percent or more because they assume supervisor time savings equal operator time savings. Separate inputs keep projections honest. Finance teams that insist on a single blended number often face pushback during capital reviews when actual results diverge from the forecast.
What data source works best for operator productivity baselines?
Time-stamped work order data from the existing CMMS or MES system provides the cleanest starting point. Manual stopwatch studies on two or three shifts add precision without excessive effort. Combining both sources gives the strongest statistical foundation for later comparisons.
How often should teams refresh the ROI inputs after launch?
Refresh at 90 days, six months, and one year. After the first year, quarterly spot checks on a single input set usually suffice unless the plant adds new lines or regulations. Refreshing more frequently than needed can create analysis paralysis without improving decision quality.
Does the connected worker platform governance checklist for regulated manufacturing plants affect ROI inputs?
Yes. The checklist forces explicit rules for audit trail retention and escalation ownership. This directly improves the supervisor compliance input and reduces hidden audit preparation costs. Plants that treat the checklist as a living document rather than a one-time checkbox see continued compliance time reductions year over year.
What happens to ROI accuracy if near-miss reporting volume spikes but closure rates lag?
The model immediately shows a growing backlog of unresolved issues. This can erase up to 40 percent of the projected quality savings unless supervisor workflows are adjusted. Adding a simple escalation timer inside the platform prevents this backlog from growing unchecked.
Should smaller plants use the same input separation as large facilities?
Yes, even two-supervisor sites benefit from role-based tracking because the relative weight of supervisor compliance time becomes proportionally larger when headcount is low. The same separation also helps justify the platform when presenting to ownership groups that want clear line-item accountability.
How should teams handle temporary or contract workers when collecting these inputs?
Temporary workers often show higher initial task times that normalize after two weeks. Separating their data prevents the overall operator productivity average from appearing artificially low during the first month of deployment.
Putting the Numbers to Work
Once the four input categories sit in a simple worksheet, finance partners can run scenarios. Change the operator productivity gain by 10 percent and watch how total project payback moves. Change the supervisor escalation speed and see the effect on quality incident costs. The exercise shows which role improvements deliver the highest marginal return and where additional training or configuration will pay off fastest. Many teams export the worksheet into their existing financial planning tool so scenario modeling stays visible to leadership during quarterly reviews. The visibility also reduces the chance of last-minute questions from the finance team during budget season. Scenario runs that incorporate ROI inputs for operators versus supervisor metrics produce more reliable forecasts.
Teams that keep operator and supervisor inputs separate also find it easier to defend the project during budget reviews. Clear line items replace vague claims about overall efficiency. The result is faster approval for the next phase of connected worker expansion across additional lines or sites. Over time this disciplined approach builds internal credibility that makes subsequent connected worker investments move from pilot to standard practice with far less resistance. Plants that adopted this method early now report that connected worker projects are routinely included in the annual capital plan rather than treated as special requests each cycle. The same discipline protects ROI inputs for operators versus any aggregated efficiency claims.
Further Reading
- Build an ROI worksheet that connects work orders, quality outcomes, and evidence
- Which value categories belong in your connected worker ROI model
- Connected worker platform ROI calculator for operators and supervisors: the worksheet inputs that withstand procurement scrutiny
- Connected frontline operator pricing in the UK for 2026: what drives cost in connected worker solutions
- Corvex connected worker integrations with your existing manufacturing IT stack: an evaluation checklist for real-world fit
{“@type”:”FAQPage”,”@context”:”https://schema.org”,”mainEntity”:[{“name”:”How do operator inputs differ from supervisor inputs in the first 90 days?”,”@type”:”Question”,”acceptedAnswer”:{“text”:”Operators focus on task speed and data entry volume while supervisors focus on exception review and closure. The two sets rarely overlap in the early weeks, so separate tracking prevents double-counting. Many plants discover that the first 30 days are almost entirely operator-driven. Supervisor benefits accelerate after the 60-day mark once dashboards mature.”,”@type”:”Answer”}},{“name”:”Can one ROI model serve both roles without adjustment?”,”@type”:”Question”,”acceptedAnswer”:{“text”:”No. Mixed models usually inflate projected savings by 30 percent or more because they assume supervisor time savings equal operator time savings. Separate inputs keep projections honest. Finance teams that insist on a single blended number often face pushback during capital reviews when actual results diverge from the forecast.”,”@type”:”Answer”}},{“name”:”What data source works best for operator productivity baselines?”,”@type”:”Question”,”acceptedAnswer”:{“text”:”Time-stamped work order data from the existing CMMS or MES system provides the cleanest starting point. Manual stopwatch studies on two or three shifts add precision without excessive effort. Combining both sources gives the strongest statistical foundation for later comparisons.”,”@type”:”Answer”}},{“name”:”How often should teams refresh the ROI inputs after launch?”,”@type”:”Question”,”acceptedAnswer”:{“text”:”Refresh at 90 days, six months, and one year. After the first year, quarterly spot checks on a single input set usually suffice unless the plant adds new lines or regulations. Refreshing more frequently than needed can create analysis paralysis without improving decision quality.”,”@type”:”Answer”}},{“name”:”Does the connected worker platform governance checklist for regulated manufacturing plants affect ROI inputs?”,”@type”:”Question”,”acceptedAnswer”:{“text”:”Yes. The checklist forces explicit rules for audit trail retention and escalation ownership. This directly improves the supervisor compliance input and reduces hidden audit preparation costs. Plants that treat the checklist as a living document rather than a one-time checkbox see continued compliance time reductions year over year.”,”@type”:”Answer”}},{“name”:”What happens to ROI accuracy if near-miss reporting volume spikes but closure rates lag?”,”@type”:”Question”,”acceptedAnswer”:{“text”:”The model immediately shows a growing backlog of unresolved issues. This can erase up to 40 percent of the projected quality savings unless supervisor workflows are adjusted. Adding a simple escalation timer inside the platform prevents this backlog from growing unchecked.”,”@type”:”Answer”}},{“name”:”Should smaller plants use the same input separation as large facilities?”,”@type”:”Question”,”acceptedAnswer”:{“text”:”Yes, even two-supervisor sites benefit from role-based tracking because the relative weight of supervisor compliance time becomes proportionally larger when headcount is low. The same separation also helps justify the platform when presenting to ownership groups that want clear line-item accountability.”,”@type”:”Answer”}},{“name”:”How should teams handle temporary or contract workers when collecting these inputs?”,”@type”:”Question”,”acceptedAnswer”:{“text”:”Temporary workers often show higher initial task times that normalize after two weeks. Separating their data prevents the overall operator productivity average from appearing artificially low during the first month of deployment.”,”@type”:”Answer”}}]}
Related Posts
Connected Worker Platform Fit for Manufacturing Integrations: A Checklist for Data, Devices, and Governance
Connected Worker Platform Fit for Manufacturing Integrations: A Checklist for…
Vendor-by-Vendor Check for Connected Worker Manufacturing
What Is Connected Worker Manufacturing? What Is Connected Worker Manufacturing?…

Connected worker platform vs handheld scanners for warehouse picking accuracy in regulated supply chains
Picking Accuracy in Regulated Supply Chains Picking Accuracy in Regulated…